The portal reports individual participants’ average records per data class. The reporting includes data such as average step count or average heart rate. You can view the records of:
- A specific participant.
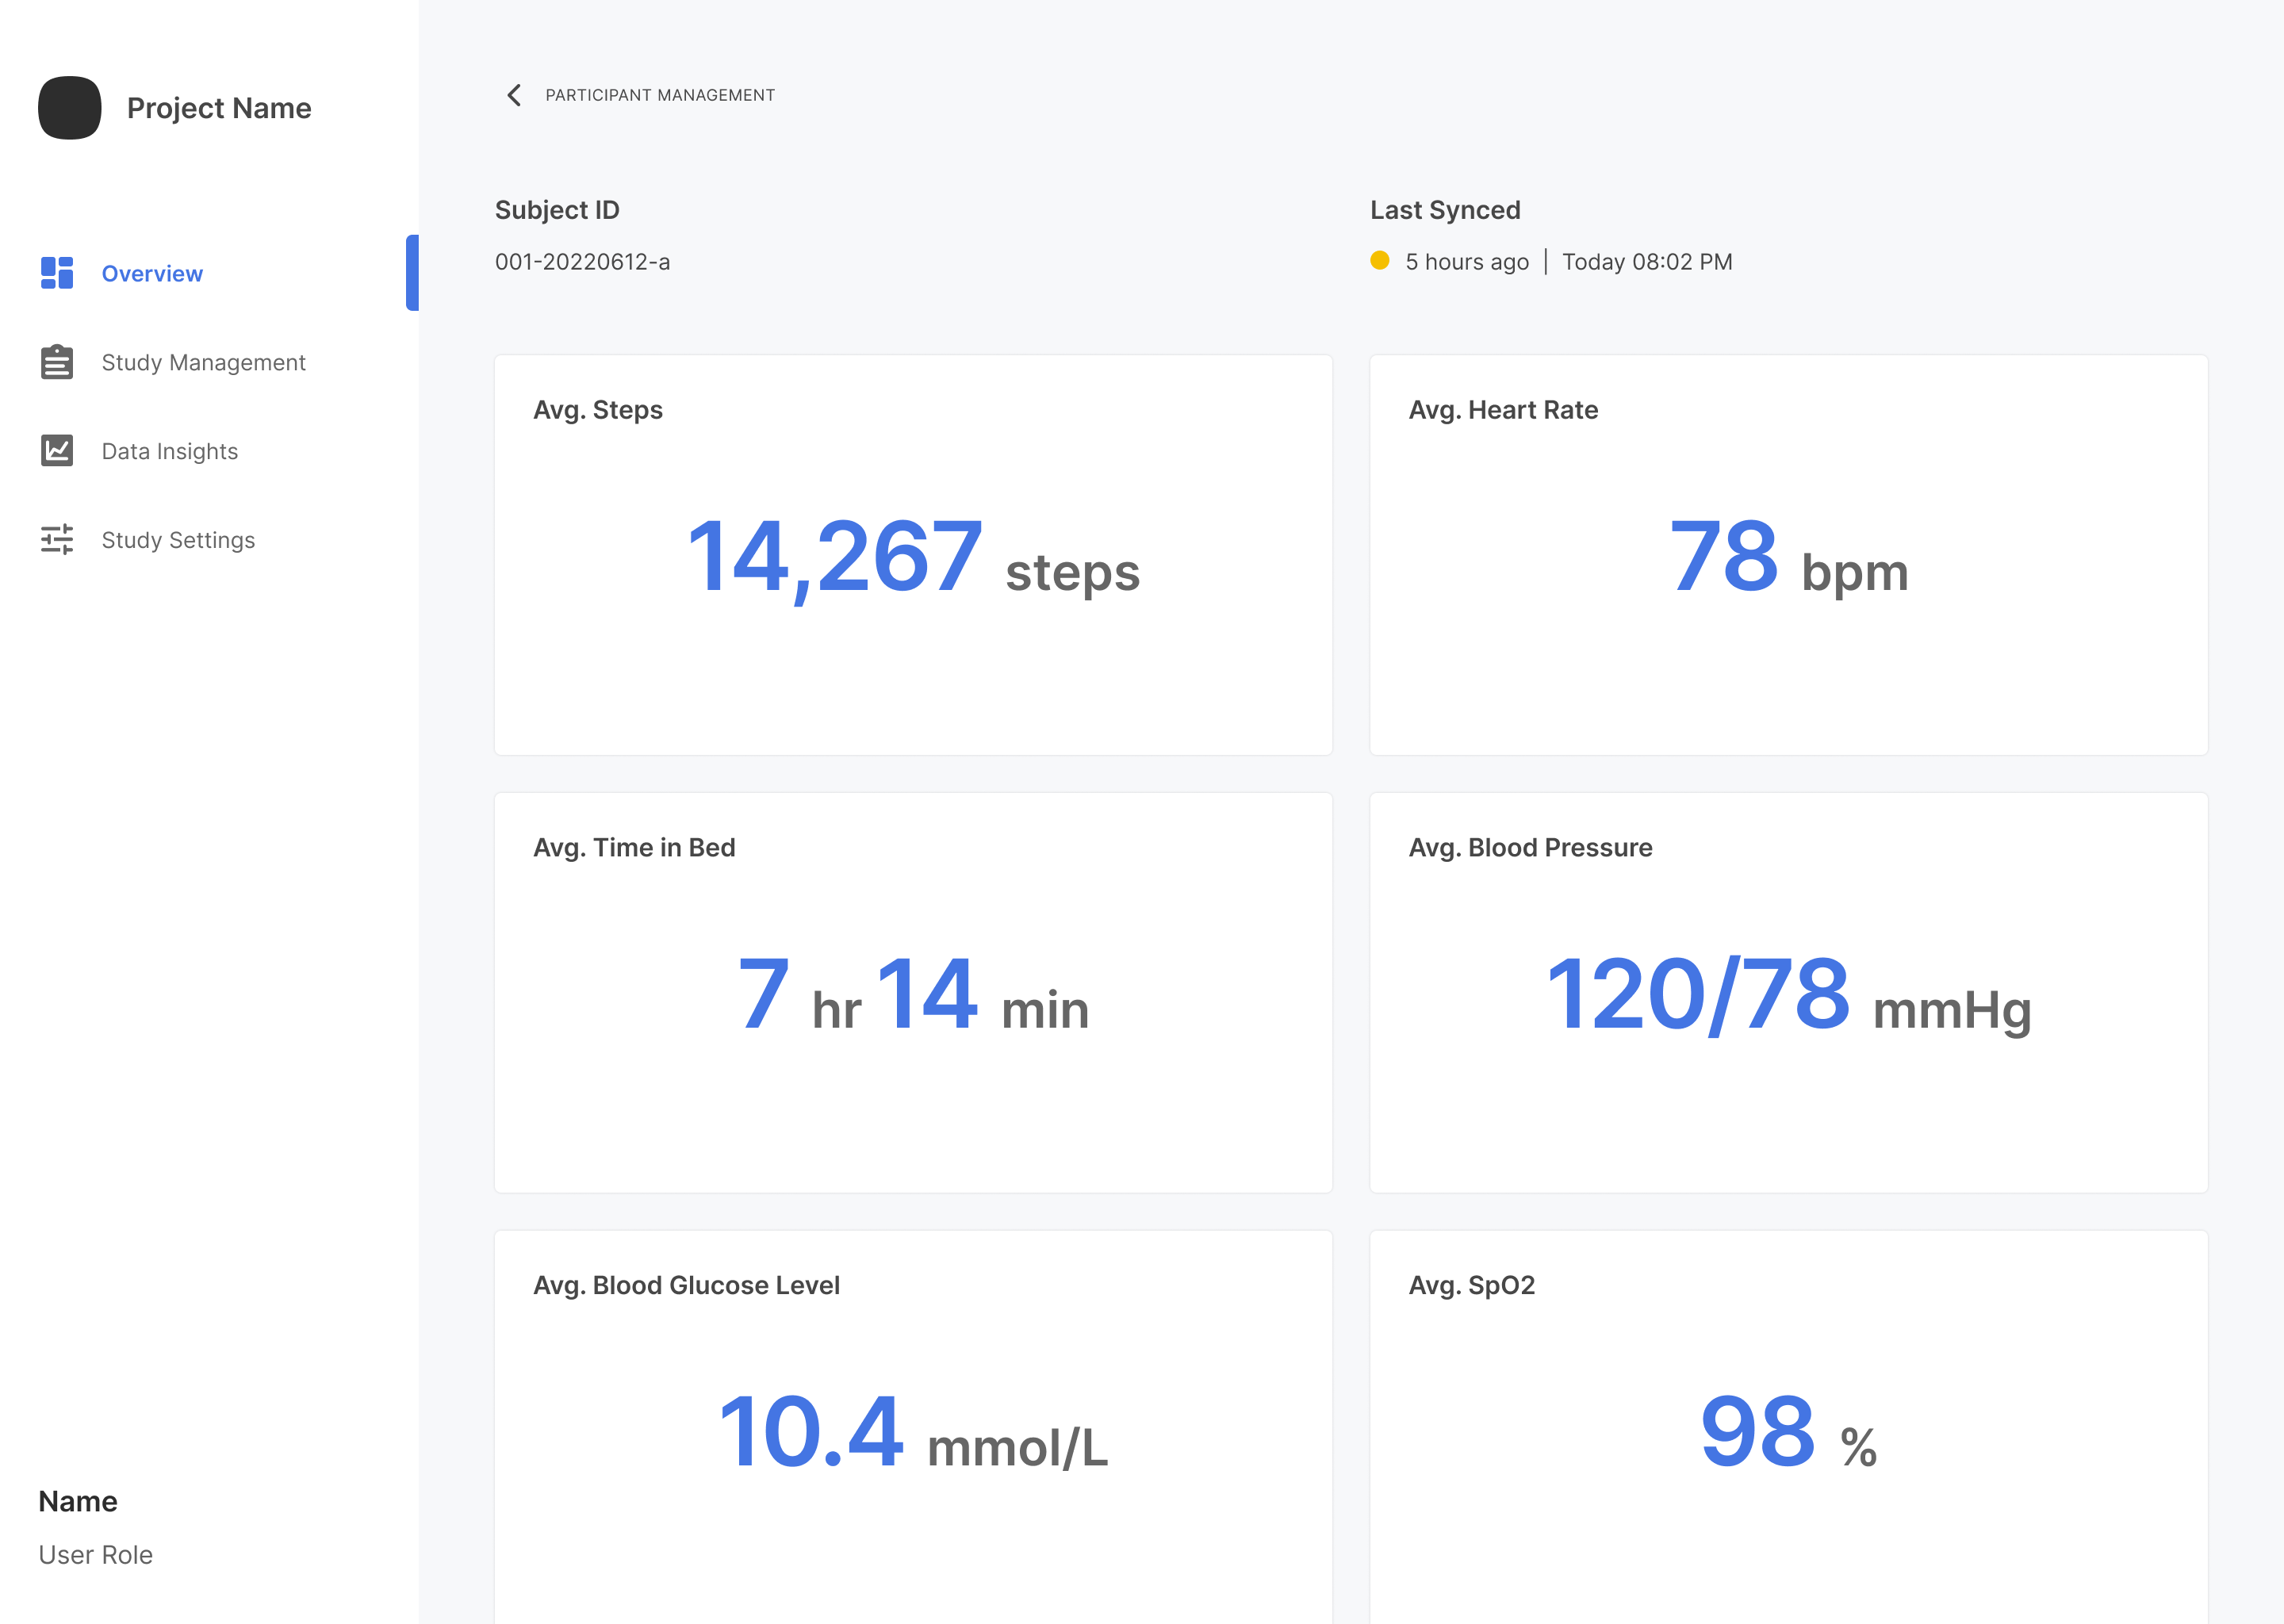
- A participant relating to a datapoint of interest.
To view individual participant records:
-
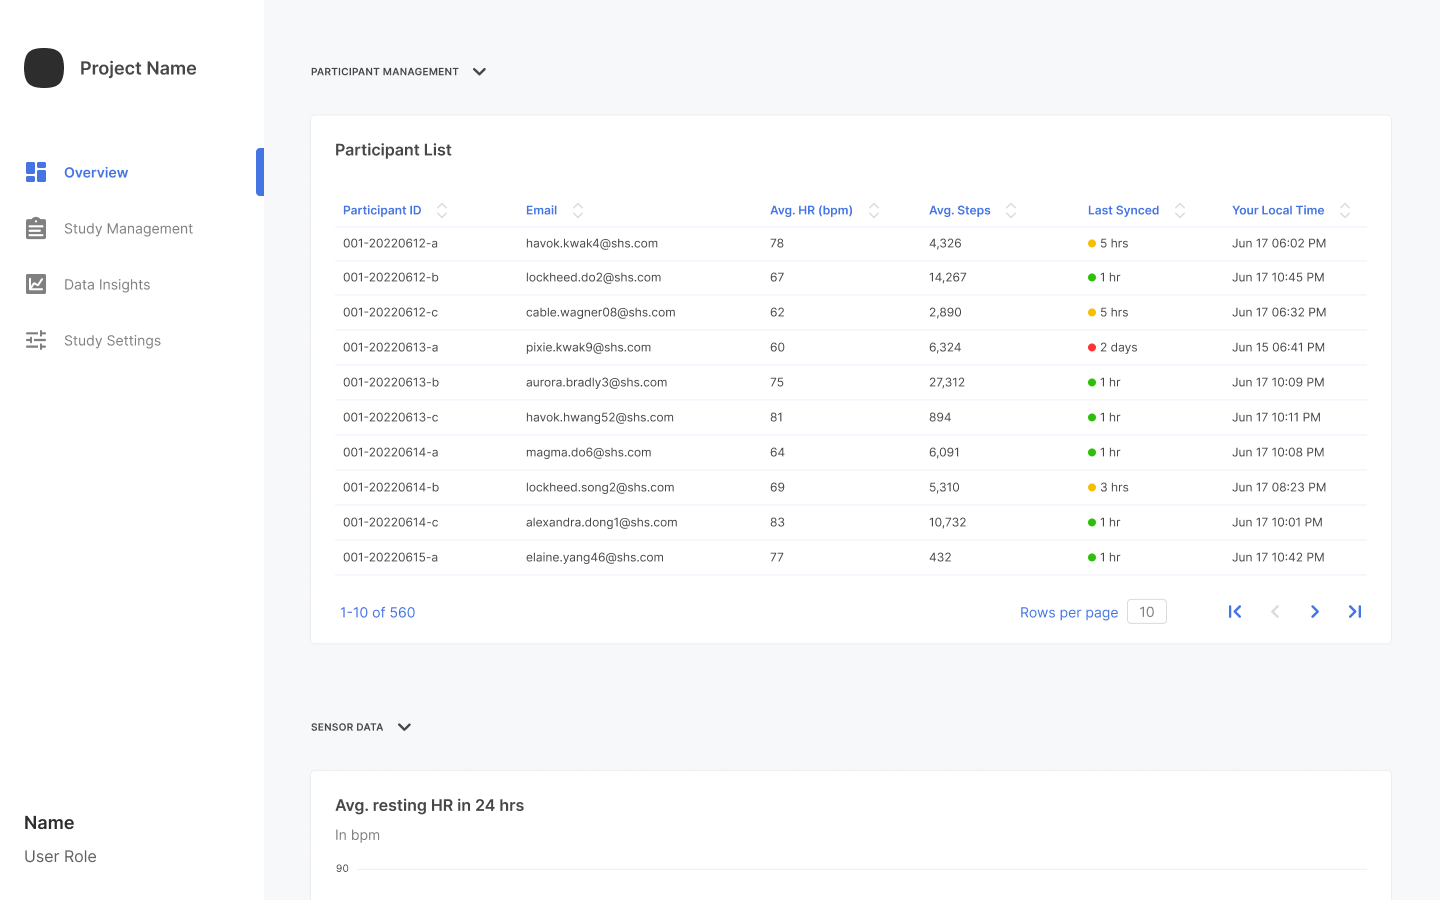
From the Overview, Study Management, or Data Insights page, navigate to the Participant Management section.
-
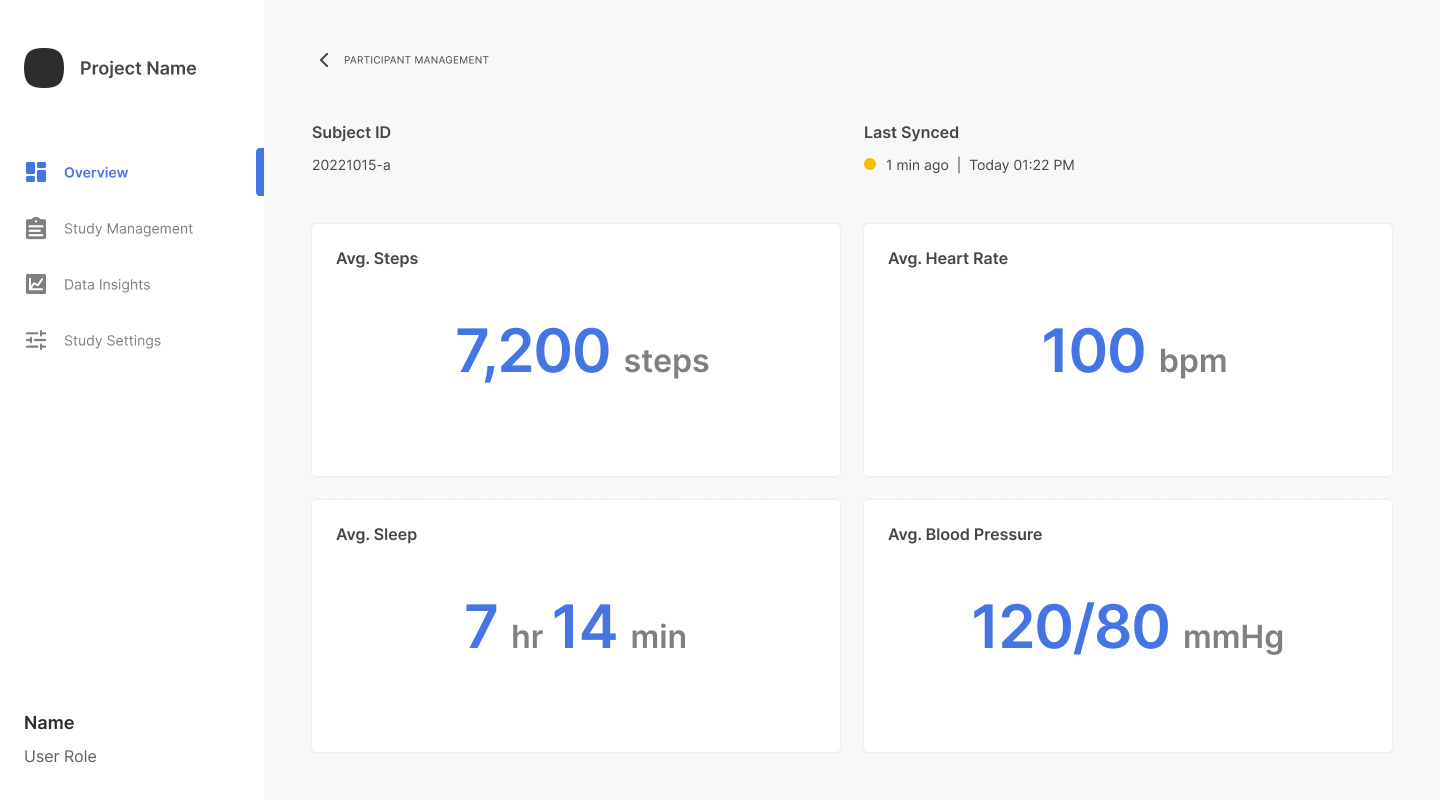
In the Participant ID column, click the desired participant.
To view records of the participant associated with a particular datapoint:
- From the Overview page, navigate to the Sensor Data section.
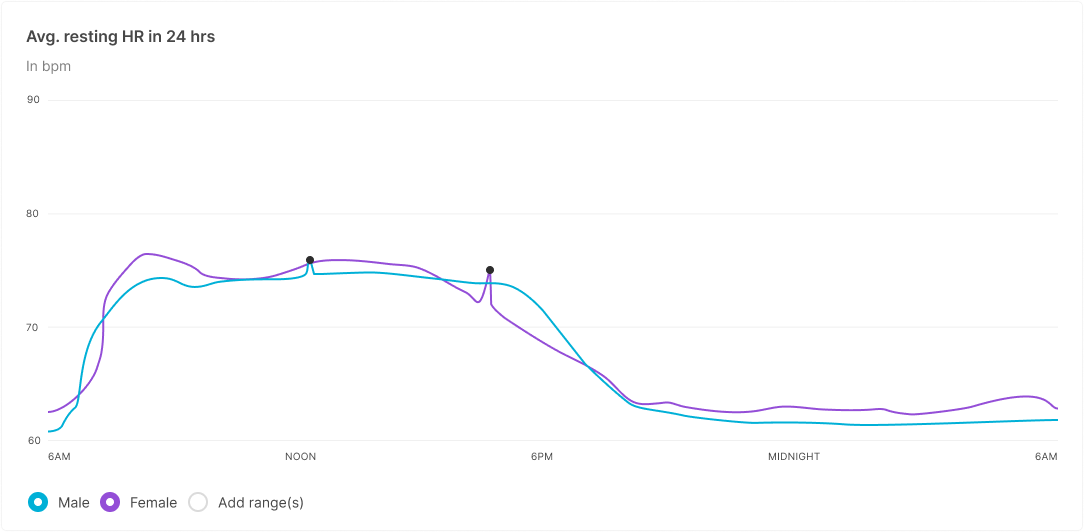
- Scroll to the desired graph or chart.
- Click a specific datapoint.
For more information about graphs and charts, refer to Viewing Graphs and Charts.